Visualizing Android Code Coverage Pt.1
@datalocaltmpDecompilers are essential when reverse engineering Android applications and binaries; unfortunately with static analysis it’s up to the reverse engineer to determine which of these complex paths to investigate.
This write-up is meant to show how to focus reverse engineering efforts to executed paths using Frida, Lighthouse, Ghidra, and Dragon Dance. At the end of this write-up you should have a solid understanding on how to visualize code coverage in Ghidra.

In this write-up we will be looking at the popular application Facebook Messenger as an example; part 2 of this series will cover writing how to generate coverage for native Android binaries (which is not currently supported).
Pre-requisites
To follow along with this write-up you’ll need to install the following tools:
- Ghidra == 9.0.2 found here.
- DragonDance currently only supports up to 9.0.2
- DragonDance Ghidra Extension found here.
- Git clone the Lighthouse Coverage Explorer here.
- Example application (Using Facebook Messenger from here).
- Frida Server & Frida Tools (Learn how to set-up Frida for Android here).
- Android emulator or device with
rootaccess
Setting up
Let’s setup Frida and find an interesting native library within our Application of choice.
- On your Android device run
./frida-server-XX.X.X-android-<arch>from /data/local/tmp - Open the app you’d like to get coverage for via the gui
- From the host terminal run
frida-ps -U | grep <packageName||applicationName>and note the Process name - Start the frida interpreter with
frida -U <processName> - From the interpreter run
Process.enumerateModules()to find all the native libraries loaded by the application (note: some libraries are only loaded as necessary and may require you hit those paths first). - From here pick a native library you’d like to reverse engineer, for this example we’ll reverse
libmsysinfra.so
Frida Tracing libmsysinfra.so
Now that we have a native library we’d like to investigate, libmsysinfra.so in this case, let’s find an exported function worth reverse engineering.
-
While the application is running, execute
frida-trace -U Messenger -i 'libmsysinfra.so!*'(Note:
'<nativeLibrary>!<functionName>'is the format associated with tracing native code with-iand this example will trace all exported functions within the native library). -
Use the application until you trigger some functionality that you are interested in; in this instance opening a Messenger Chat has triggered the function
MCQMessengerOrcaAppLoadThreadViewData()which has subsequently called many many additional functions, quite interesting!

- Extract the native library and load it into Ghidra
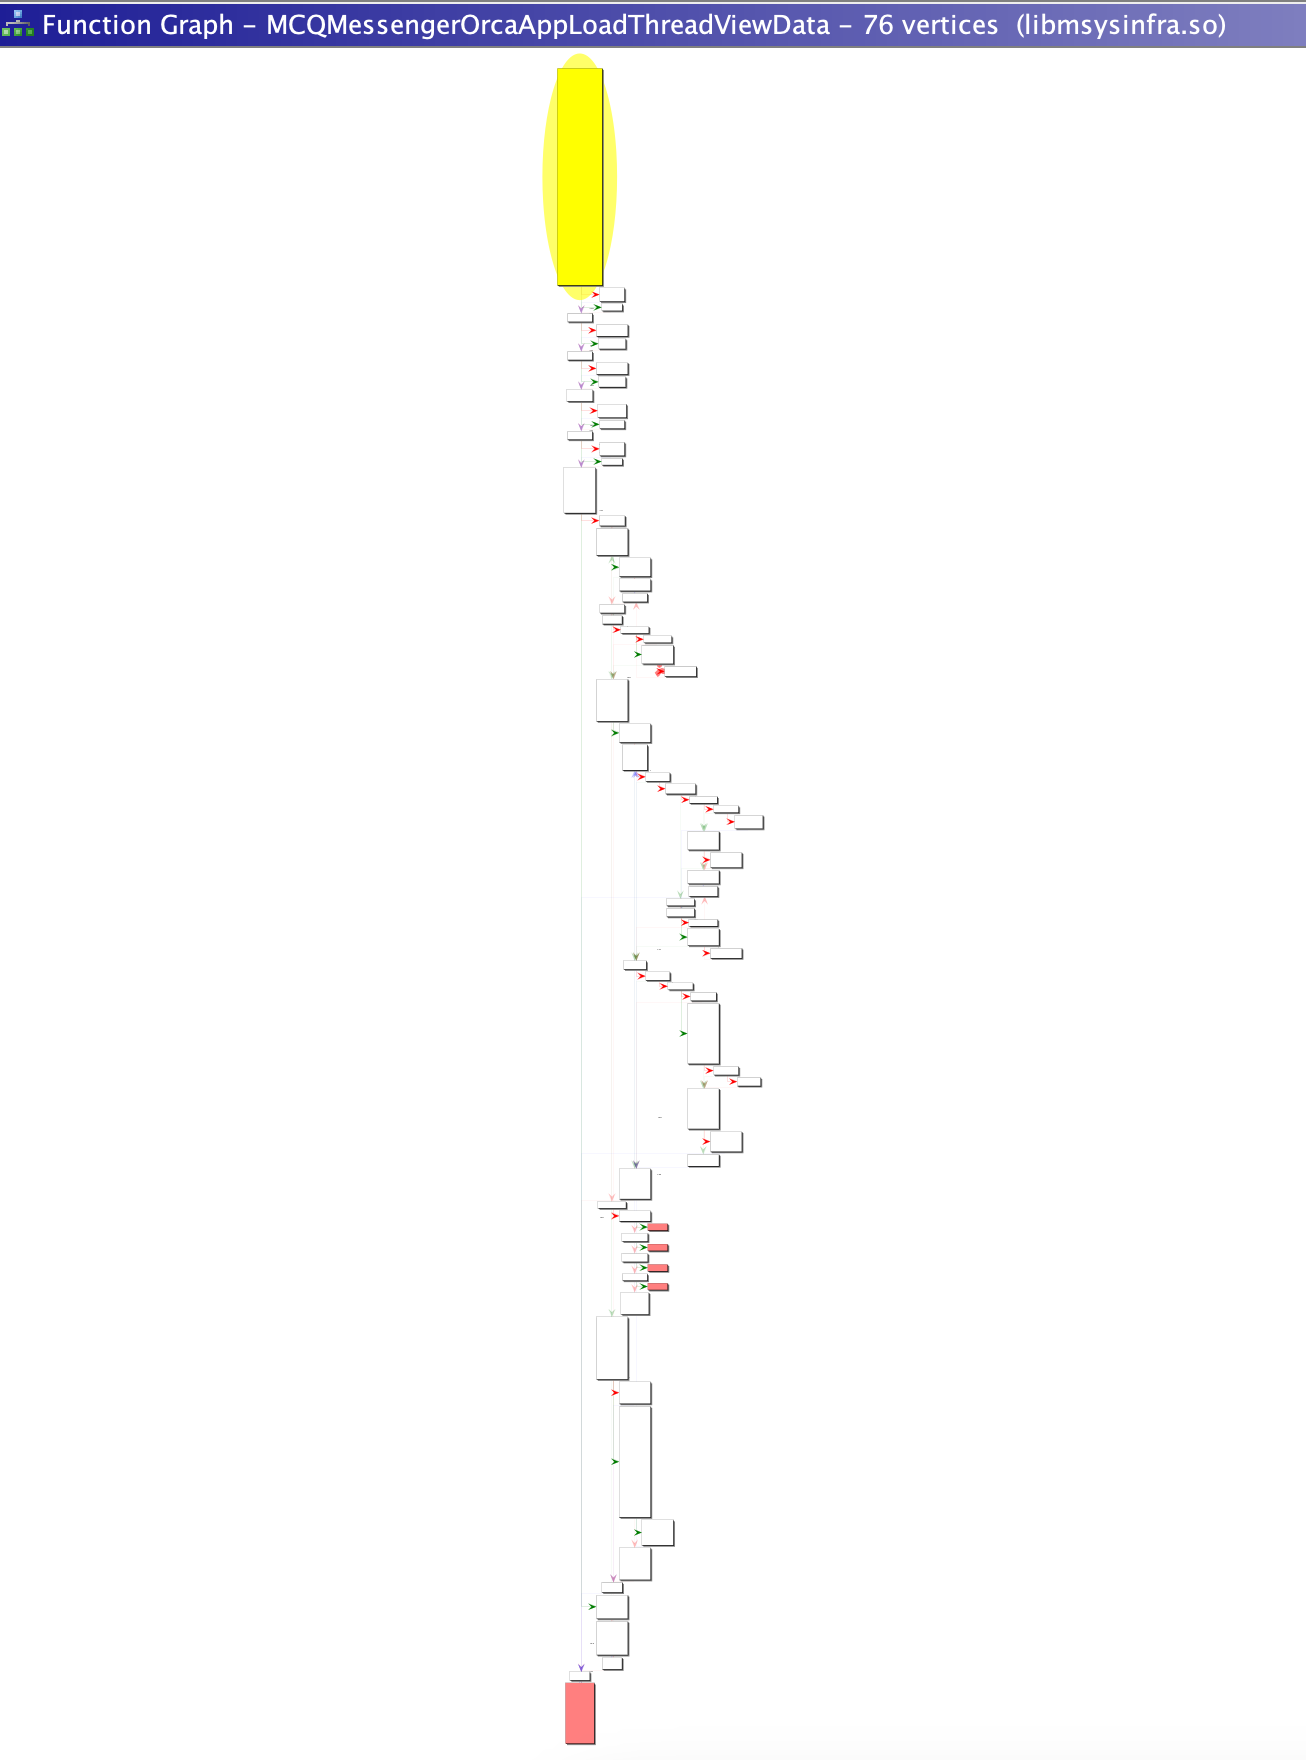
- Find the initial function we’ll be starting with in Ghidra and marvel at it’s complexity, how can we narrow down our reversing? Coverage!
Generating Code Coverage for MCQMessengerOrcaAppLoadThreadViewData()
Lets generate a visualization of the executed basic blocks to help guide how we focus our reverse engineering efforts.
- Navigate to
lighthouse/coverage/fridadirectory - Execute
python3 frida-drcov.py -D emulator-5554 Messenger(Note: this will crash the application, we will need to narrow our search before generating the coverage)
To narrow our results we’ll use the -w and -t flags described below:
usage: frida-drcov.py [-h] [-o OUTFILE] [-w WHITELIST_MODULES] [-t THREAD_ID] [-D DEVICE] target
-
To find the thread ID we’ll need to use another terminal and trace our function of interest with:
frida-trace -U Messenger -i 'libmsysinfra.so!MCQMessengerOrcaAppLoadThreadViewData' -
While the function is being traced, use the application to trigger the function and note the thread ID, in the image below it’s
0x2dbewhich corresponds to11710in decimal. Using this thread ID and library filter we are able to capture 1118 blocks of coverage which are saved tofrida-cov.log

DragonDance Visualization
Now we have the coverage data for our function of interest let’s use Dragon Dance Ghidra extension to visualize the basic blocks executed.
- Install the extension using the instructions here.
-
Once the extension is installed, open the native library to analyze and from
Window>Dragon Danceadd the coverage file generated in the previous section.
- Right-click the coverage file and select “switch-to”; if you have Ghidra viewing the the function of interest it should immediately change colour to blue/purple/red if coverage has been found.
- Marvel and the beauty of a coloured function graph knowing that you’ve just clarified your reverse engineering path!
